Promotion

Click here to view our latest promotion.

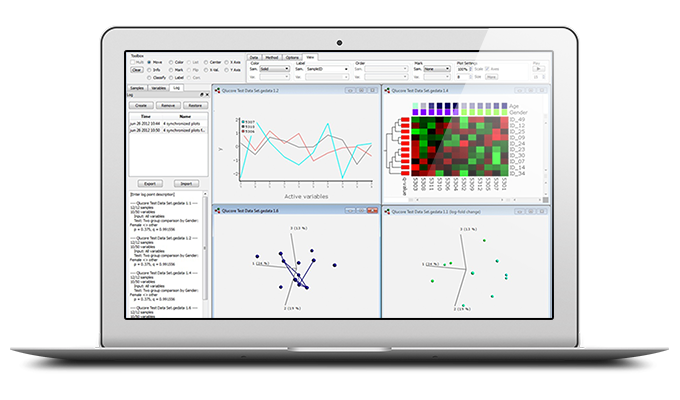
Qlucore Omics Explorer is a D.I.Y next-generation bioinformatics software for research in life science, plant- and biotech industries, as well as academia. The powerful and flexible visualization-based data analysis tool with inbuilt powerful statistics delivers immediate results and provides instant exploration and visualization of big data. The software is developed to allow the workflow which best suits you and your experiments and maximizes the outcome of your research. Qlucore Diagnostics software is a platform for multi-omics companion and precision diagnostics. AI-powered, disease-specific machine learning-based classifier models are combined with patient-friendly visualizations in a an easy to use and cost-effective software solution that integrates with a wide range of data-generating techniques and instruments

Qlucore Omics Explorer is used by scientists and corporations in over 35 countries to facilitate data analysis and interpretation and is used by the best universities, research institutes and pharma companies worldwide. There are more than 700 peer-reviewed articles in leading journals in which the program has been referenced.


With Qlucore OmicsExplorer you can also expand your analysis by using integrated tools such as GSEA an GO Browser. The software works on many types of data and you can quickly analyze and explore data sets such as:

Gene expression: microarrays, RNA-seq, real-time PCR

NGS, DNA-seq, RNA-seq

MicroRNA: microarrays, RNA-seq, real-time PCR

DNA methylation: microarrays

Protein expression: microarrays, antibody arrays, 2-D gels, LC-MS

Metabolomics

Flow cytometry data

and any normalized multivariate data


The data analysis software takes full advantage of all annotations and other links that are connected with the data being studied, as well as a number of advanced statistical functions such as false discovery rates (FDR), f-tests, ANOVA and p-values.

One of the key methods used by Qlucore Omics Explorer to visualize data is the dynamic principal component analysis (PCA), an innovative way of combining PCA analysis with immediate user interaction. PCA analysis works by projecting high dimensional data down to lower dimensions. The specific projections of the high-dimensional data are chosen in order to maintain as much variance as possible in the projected data set. Data is projected and plotted on the two-dimensional computer screen and then rotated manually or automatically.


Download a trial version today at www.qlucore.com.

Contact us at Tel: 603-8068 9980
Fax: 603-8068 9011
Send us a messageinfo@genomax.com.my

Visit us 9F-1B, Level 9, Tower 2 @ PFCC, Jalan Puteri 1/2, Bandar Puteri, 47100 Puchong, Selangor


rolex replica replica rolex replica watches replica rolex replica rolex watches rolex replica rolex replica replique montre replique montre uhren replica